Tropical Cyclone Larry - Data Analysis
Tropical Cyclone Larry - Data Analysis
Severe Tropical Cyclone Larry Category 5 struck the coast at Innisfail far north Queensland Australia during the morning of 20 March, 2006
This is a compilation of data and imagery from various sources
(Note: this page contains materials © Copyright Commonwealth of Australia 2006, Bureau of Meteorology (ABN 92 637 533 532)
used with permission plus personal imagery, satellite imagery, private photos and survivor accounts)
see also -- we were there! Earth Science Australia's
exclusive photos!
see also Tropical Cyclones...
see also Origins of Extreme Weather...
Summary
Track
Impact Details
Observations
Satellite Images
Explosive Convection Cyclone Larry
Radar Images
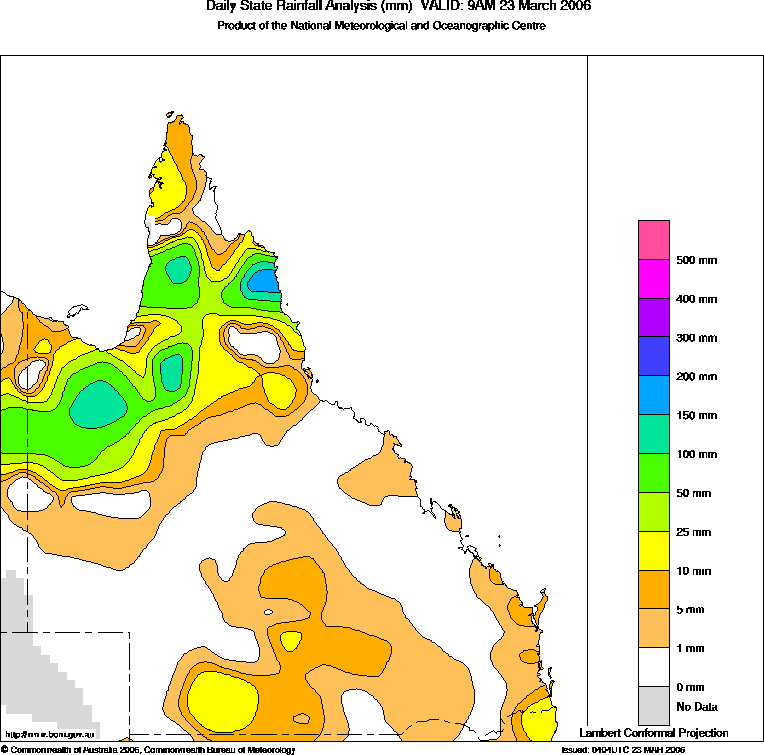
Rainfall
Impact Photos
Wave and Tide graphs
First hand accounts by those who experienced Cyclone Larry
Snakes and Sharks
Esther
Adrian
John 1
Tom
Kirsty
John 2
Robert
Dan
What is a Category 5 Cyclone?
How the Saffir-Simpson Scale for rating Cyclone Intensity
was devised (interview)
Saffir-Simpson Scale for rating Cyclone Intensity
Cyclone Rating System used in Australia
International Definitions (Severe Tropical Cyclones,
Typhoons and Hurricanes)
Economic impacts of the Cyclone
Flooding
Affect of Cyclone Larry on Avocado Growers (press
release)
How does Cyclone Larry compare to other cyclones?
Comparison to the damage inflicted by an nuclear bomb
© Copyright Commonwealth of Australia 2006, Bureau of Meteorology (ABN 92 637 533 532)
Summary
Severe Tropical Cyclone Larry crossed the tropical north Queensland coast near Innisfail during the morning of 20 March, 2006. Major damage to homes and other buildings was caused by Larry as well as extensive damage to local crops. Larry was quite small in size (like Severe Tropical Cyclone Ingrid that crossed the coast near Cooktown in March 2005). Major damage was along the portion of coast between Cairns in the north and Cardwell in the south. Fortunately Larry crossed the coast on a neap tide, so the significant storm surge and effects of the waves only caused the sea level to exceed highest astronomical tide in a few locations and resulted in only minor salt water inundation.
Apart from Severe Tropical Cyclone Ingrid, Larry is the first severe tropical cyclone to cross the Queensland east coast since Rona in 1999 (which crossed near the Daintree River north of Cairns). The most damaging cyclone impacts on Queensland's east coast prior to Larry were:
- Aivu in 1989 - category 3 impact near Ayr (south of Townsville)
- Winifred in 1986 - category 3 impact near Innisfail
- Althea in 1971 - category 4 impact just north of Townsville
- Ada in 1970 - category 4 impact over the Whitsunday Islands
- Innisfail cyclone in 1918 (not named) - category 5 impact
- Mackay cyclone in 1918 (not named) - category 5 impact
- Mahina in 1899 - category 5 impact near Bathurst Bay on Cape York Peninsula
Track
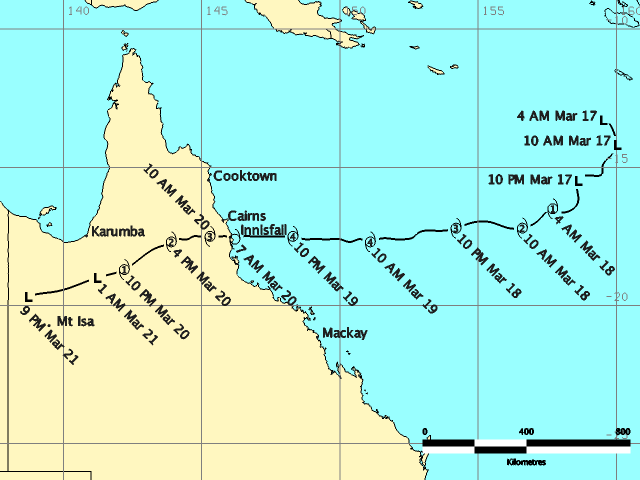
Severe Tropical Cyclone Larry began as a low pressure system over the eastern Coral Sea that was monitored by the Bureau of Meteorology from 16 March. It formed into a tropical cyclone in the early hours of 18 March, and proceeded on an almost due westerly track towards the Queensland coast, intensifying as it travelled. Larry became a severe tropical cyclone (category three or higher) at 10am on 18 March, and continued to intensify as it approached the Queensland coast, reaching Category 4 early on 19 March. Just before crossing the coast, satellite picture interpretation techniques indicated that Larry had an estimated intensity of Category 5. The eye of Larry crossed the coast near Innisfail between 6:20am and 7:20am on 20 March. Larry started to weaken after crossing the coast but maintained cyclone strength for several hundred kilometres inland until the early hours of 21 March. Ex-tropical cyclone Larry was further tracked as it moved into western Queensland to the north of Mount Isa.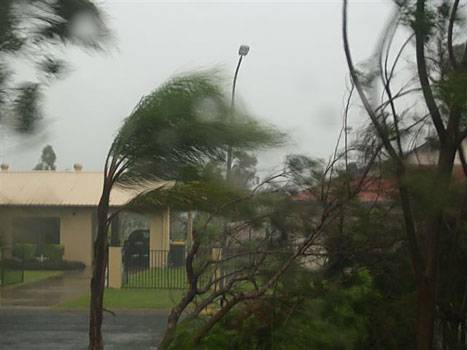
Impact
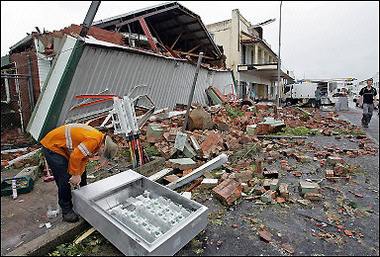
Severe Tropical Cyclone Larry is the first severe tropical cyclone to cross near a populated section of the east coast of Queensland since Rona in 1999, and the effects of the winds on buildings were devastating. Townships affected by the northern and southern portions of the eyewall of the cyclone received the most damage, particularly Babinda and Silkwood, however all townships in the region were severely affected by the cyclone.
| Location | Damage |
|---|---|
| Mareeba / Eacham / Millaa Millaa | 93 damaged properties |
| Babinda | 80% of buildings damaged |
| Flying Fish Point | 15% of homes damaged |
| Innisfail | 50% of homes damaged 35% of private industry damaged 25% of Government buildings damaged (schools etc) |
| Etty Bay | 40% of homes suffered roof damage |
| East Palmerston | 70% of homes damaged |
| Silkwood | worst affected location 99% of homes lost roofs or suffered structural damage |
| Kurrimine Beach | 30% of homes damaged 15% of private industry damaged |
| El Arish | 30% of homes damaged 50% of private industry damaged |
| Bingil Bay | 30% of homes damaged |
| Mission Beach | 30% of homes damaged 20% of private industry damaged 45% of caravan park damaged |
| South Mission Beach | 20% of homes damaged 20% of private industry damaged |
| Jappoonvale | Possible tornado damage |
Electricity transmission to the areas above (as well as Cairns) was severely disrupted. Road and rail access to the region was also disrupted for several days due to flooding. In the northwest of the state, heavy rainfall from ex-Tropical Cyclone Larry caused several townships to be isolated for several days due to flooding.
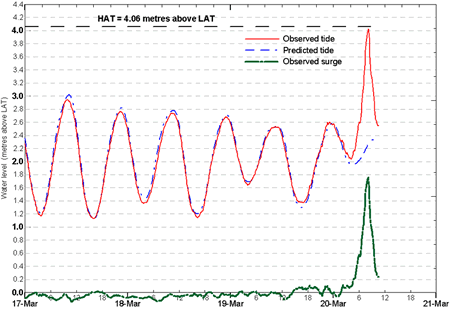
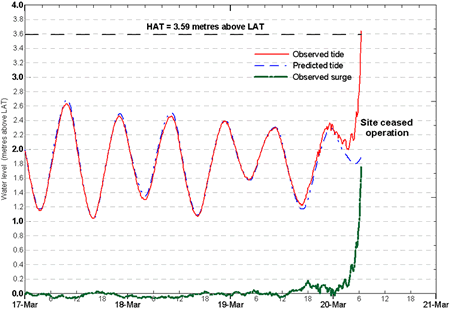
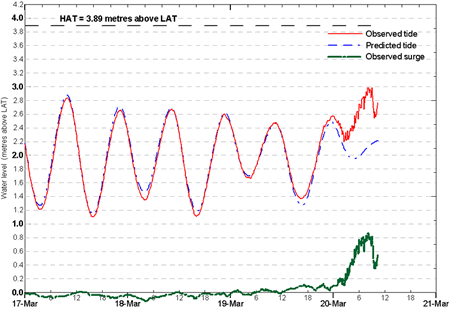
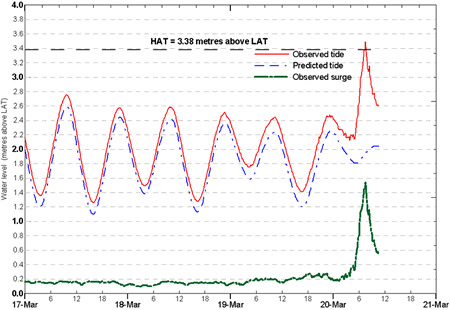
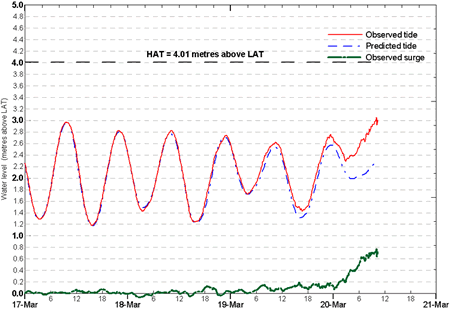
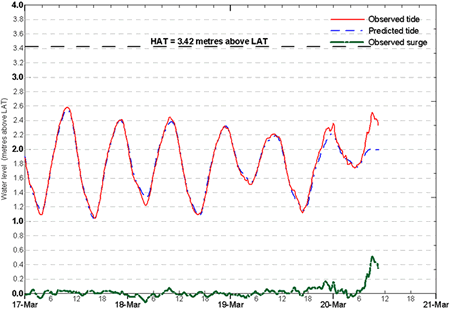
A significant storm surge was caused by Severe Tropical Cyclone Larry, with sea levels exceeding the predicted tide by 1.75m at Clump Point (at which point the instrument stopped recording prior to landfall), 1.76m at Cardwell and 1.54m at Mourilyan. Surges of greater than 0.5m were experienced at all recording stations from Cairns to Townsville. However predicted tides were approximately 1.5m below the Heightest Astronomical Tide (HAT) at the time of coastal crossing, so the total water level equalled of only just exceeded HAT by a few centimetres at Cardwell, Clump Point and Mourilyan.
Observations Summary (Last Updated 7April 2006)
Note: all times are AESTThe information shown below was preliminary only.
Initial investigations indicate that wind flows associated with Severe Tropical Cyclone Larry were complicated possibly by the steep terrain encountered at landfall. In some places there is also evidence of damage consistent with tornadoes being generated. Click here for a satellite image showing the explosive convection that occurred upon landfall (image from University of Wisconsin).
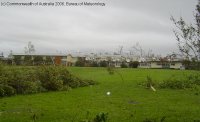
The closest official instrumented observation site was the Bureau of Meteorology's Automatic Weather Station(AWS) at South Johnstone. The maximum gusts are recorded in the table below. Images of the AWS (looking south) taken in 2002 before TC Larry and the day after TC Larry (shown below...) show that the nearby buildings remained largely unaffected consistent with the observed winds. However the distant hill has obvious tree damage and erosion indicating possibly much higher windspeeds.
The following images...© Copyright Commonwealth of Australia 2006, Bureau of Meteorology (ABN 92 637 533 532)used with permission
Click on any image for a larger version in a new window...
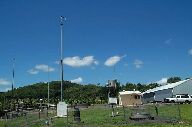 BEFORE
CYCLONE: South Johnstone AWS (2002)
BEFORE
CYCLONE: South Johnstone AWS (2002)Click image to enlarge (41 KB)
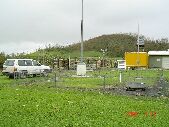 SAME
SITE SHOWN AFTER CYCLONE: South Johnstone AWS 21/03/06 note: buildings
largely intact but hill behind stripped of vegetation
SAME
SITE SHOWN AFTER CYCLONE: South Johnstone AWS 21/03/06 note: buildings
largely intact but hill behind stripped of vegetationClick image to enlarge (81 KB)
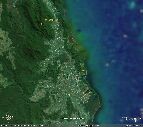 Google-Earth image with placenames
Click image to enlarge (119 KB)
Innisfail Region Wind Observations
20 March 2006
| Innisfail (estimated winds only) | South Johnstone Automatic Weather Station | |
| 3.30am | 50 - 60 km/h from S-SSW | 17 km/h from SW with gusts to 33 km/h |
| 4.50am | 120 km/h from S-SSW | 20 km/h from SSW with gusts to 42 km/h |
| 6.00am | 180 km/h from S-SSW | 63 km/h from S-SSW with gusts to 142 km/h |
| 6.30am | 200 km/h from S-SSW with gusts to 250 km/h | 78 km/h from S-SSW with gusts to 128km/h |
| 6.38am | 81 km/h from S-SSW with gusts to 181 km/h | |
| 6.50am | beginning of eye, calm winds | 89 km/h from S with gusts to 139 km/h |
| 7.20am | end of eye | 74 km/h from SE with gusts to 105 km/h |
| 7.30am | 200 km/h from N-NNE | 83 km/h from E with gusts to 130 km/h |
| 8.00am | 250 km/h from N-NNE | 93 km/h from ENE with gusts to 128 km/h |
| 8.10am | 290 km/h from N-NNE with gusts to 310-320 km/h | 91 km/h from ENE with gusts to 124 km/h |
| 8.30am | 250 km/h from N-NNE with gusts to 290 km/h | 91 km/h from ENE with gusts to 126 km/h |
| 9.00am | 210 km/h from NE with gusts 220-250 km/h | 76 km/h from ENE with gusts to 124 km/h |
| 10.00am | 70 km/h from NE with gusts 100-120 km/h | 54 km/h from ENE with gusts to 120 km/h |
| 11.00am | 50 km/h from NE with gusts 60-80 km/h | 37 km/h from NE-ENE with gusts to 54 km/h |
| 12 noon | 40 km/h from NE with gusts 50-60 km/h | 30 km/h from NE-ENE with gusts to 43 km/h |
Maximum Measured Wind Gusts
| Flinders Reef | 114 knots / 211 km/h at 9.10pm 19 March 2006 |
| Hamilton Island Airport | 53 knots / 98 km/h at 10:58pm 19 March 2006 |
| Alva Beach | 43 knots / 80 km/h at 5.31am on 20 March 2006 |
| Low Isles | 41 knots / 76 km/h at 9:00am 20 March 2006 |
| Green Island | 59 knots / 109 km/h at 7:04am 20 March 2006 |
| Cairns Airport | 58 knots / 107km/h at 8:01am 20 March 2006 |
| Mareeba | 61 knots / 113 km/h at 8:39am 20 March 2006 |
| South Johnstone | 98 knots / 181 km/h at 6:33am and 6:38am 20 March 2006 |
| Lucinda | 59 knots / 109 km/h at 5:32am 20 March 2006 |
| Bellinden Ker Tower 7 (elevation approx 1450m)* | 159 knots / 294 km/h at 7:18am 20 March 2006 |
| Ravenshoe Wind Farm** | 100 knots / 187 km/h at 8:40am 20 March 2006 |
Maximum Measured Sustained Winds
| Low Isles | 37 knots / 68 km/h at 9:00am 20 March 2006 |
| Green Island | 46 knots / 85 km/h at 7:04am 20 March 2006 |
| Cairns Airport | 29 knots / 54 km/h at 7:42am |
| Mareeba | 40 knots / 74 km/h at 9:00am 20 March 2006 |
| South Johnstone | 48 knots / 89 km/h at 6:50am 20 March 2006 |
| Flinders Reef | 84 knots / 155 km/h at 9:10pm 19 March 2006 |
| Cardwell | 47 knots / 87 km/h at 6:00am and 9:00am 20 March 2006 |
| Lucinda | 44 knots / 81 km/h at 4:00am 20 March 2006 |
Lowest Reported Pressure
| Flinders Reef, 9:00pm 19 March 2006 | 973.1 hPa |
| South Johnstone, 6:56am 20 March 2006* | 959.3 hPa |
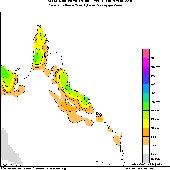
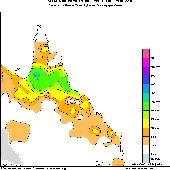
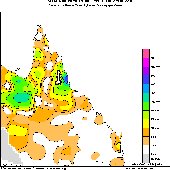
Rainfall Data
Forecast Coastal Crossing Parameters (at 5:45am 20 March 2006)
| Crossing location | Innisfail region |
| Category when crossing the coast | 5 (estimated, subject to ground investigation) |
| Speed of movement | 25 km/h to the west |
| Estimated Maximum Wind Gusts | up to 290 km/h |
| Estimated Central Pressure | 915 hPa |
| Estimated Storm Surge | 2-3m between Mourilyan and Cardwell |
| Eye Radius | 15-20 km |
| Radius of Maximum Winds | 20-30 km |
| Radius of Very Destructive Winds | 40-50 km |
| Radius of Destructive Winds | 120 km |
Satellite Imagery
Images from MTSAT-1R satellite received and processed by Bureau of Meteorology courtesy of Japan Meteorological Agency.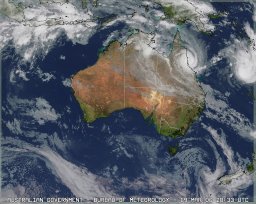 Australia, 20/03/06, 6:30am AEST
(infra-red) Click to enlarge (1086 KB)
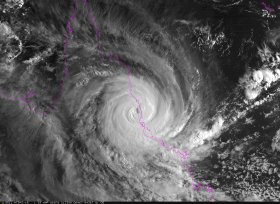 Queensland, 20/03/06, 7:30am AEST
(infra-red) Click to enlarge (1014 KB)
Explosive Convection Causes Larry to be disrupted onto a series of tornado-like entities
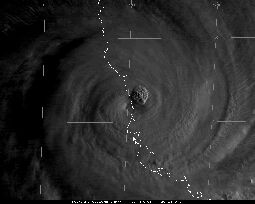 Innisfail area, 20/03/06, 6.30am AEST(Visible)
showing explosive convection Click to enlarge (84 KB)*
Innisfail area, 20/03/06, 6.30am AEST(Visible)
showing explosive convection Click to enlarge (84 KB)**this image courtesy of University of Wisconsin (USA).
© Copyright Commonwealth of Australia 2006, Bureau of Meteorology (ABN 92 637 533 532)
used with permission
More satellite imagery (large files)
Just before landfall
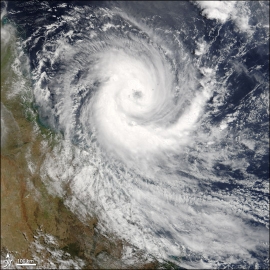 Just before landfall Large image is 3.7 megs!
Click image to enlarge...
Just after landfall
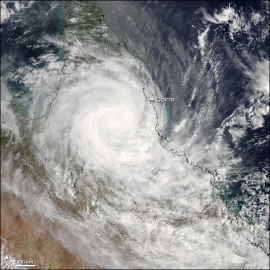 Just
after landfall Large image is 4.7 megs!
Just
after landfall Large image is 4.7 megs!Click image to enlarge...
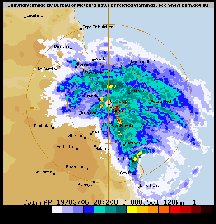 Cairns
Airport 20/03/06, 6:20am AEST
Cairns
Airport 20/03/06, 6:20am AESTClick image to enlarge (33 KB)
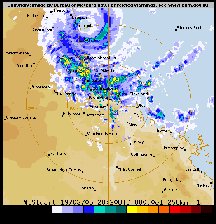 Townsville(Mt Stuart) 20/03/06, 6:20am AEST
Click image to enlarge (35 KB)
© Copyright Commonwealth of Australia 2006, Bureau of Meteorology (ABN 92 637 533 532)used with permission
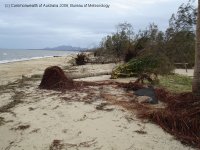
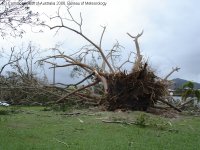
Cyclone Impact Images
Click image to open larger version...
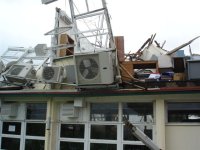 Innisfail
State High School reopened a week later
Innisfail
State High School reopened a week later58 KB
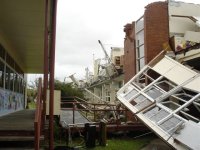
66 KB
80 KB
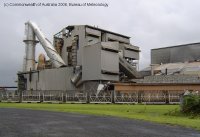 Mourilyan
Sugar Mill never re-opened
Mourilyan
Sugar Mill never re-opened87 KB
123 KB
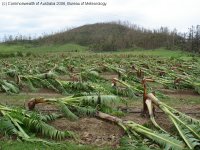
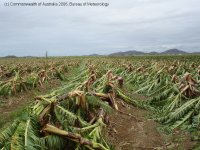 Banana
crop destroyed no new bananas for 7-10 months, many casual jobs lost
Banana
crop destroyed no new bananas for 7-10 months, many casual jobs lost138 KB
157 KB
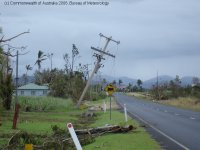 Many
homes
without power 2+weeks
Many
homes
without power 2+weeks81 KB
There was talk of putting critical electrical infastructure underground particularly in the town centre but this never eventuated.
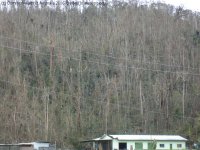 World
Heritage Rainforest blasted of leaves
World
Heritage Rainforest blasted of leaves136 KB
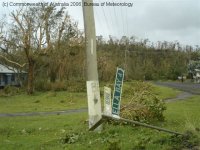
134 KB
75 KB
© Copyright Commonwealth of Australia 2006, Bureau of Meteorology (ABN 92 637 533 532) used with permission
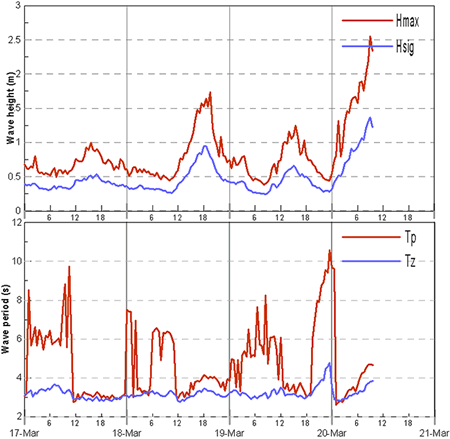
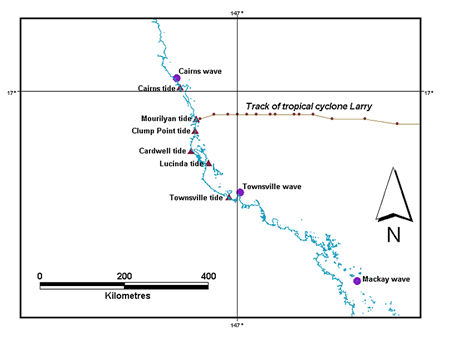
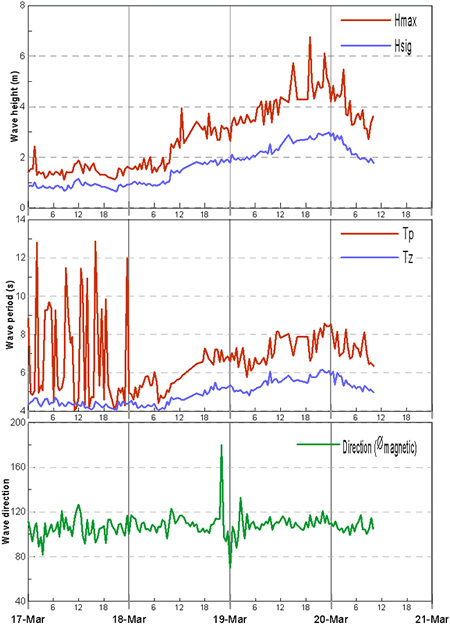
Wave and Tide graphs of Cyclone Larry
Cairns tide plot [ 12 kb]
Cairns wave plot [ 13 kb]
Cardwell tide plot [ 13 kb]
Clump tide plot [ 13 kb]
Location plot [ 10 kb]
Lucinda tide plot [ 13 kb]
Mackay wave plot [ 18 kb]
Mourilyan tide plot [ 13 kb]
Townsville tide plot [ 12 kb]
Townsville wave plot [ 12 kb]
Cairns tide plot [ 12 kb]
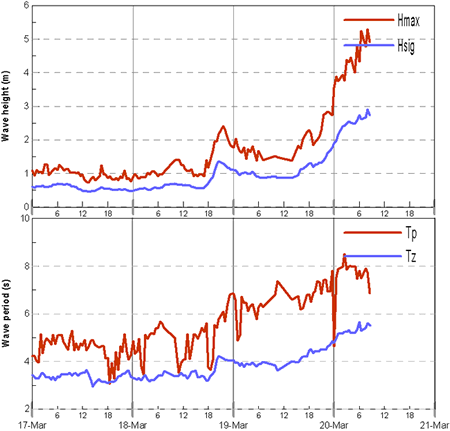
Townsville wave plot [ 12 kb]
© Copyright Commonwealth of Australia 2006, Bureau
of Meteorology (ABN 92 637 533 532) used with permission
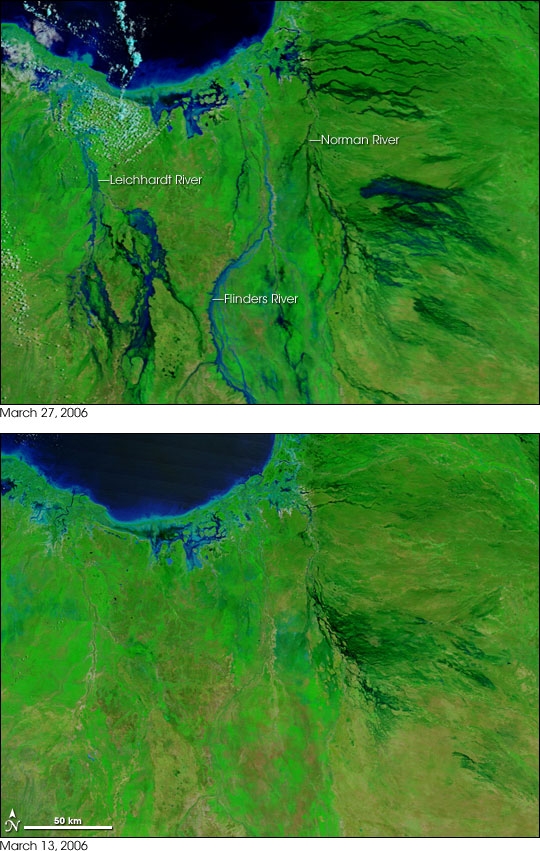
Snakes and Sharks by Kylie Camp
Major flooding in Queensland's north-west has led to sharks invading one rural property 80 kilometres inland.Locals from the region, 200 kilometres north of Mount Isa, say the area around the Leichhardt River is having its worst floods since 1964.
Kylie Camp from Floraville Station says river levels that are normally 12 metres below the Leichhardt Falls are now 12 metres above that level.
She says the record flooding has now given sharks access to the station.
"I've never seen so many snakes in my life and also some sharks as well," she said.
"We do see sharks sometimes below the waterfalls that are normally here, probably just trying to get out of the fast moving current into somewhere quieter.
"This is the biggest recorded flood here I think - it's the first time I've ever seen such a thing."
Esther
It started off a bit windy for a few hours then all of a sudden it picked up like in an instant. The winds were really strong and small bits of debris were flying around. Before we knew it, Larry had upgraded to Category 5. Trees were uprooted and bending over. We were sure that our windows were going to smash as the force of the winds against them were increasing. There was also a lot of rain and it was scary. We had only got the side of Larry so imagine what Innisfail got. Our hearts go out to them. It's a miracle that no-one died.Esther, Cairns, Australia
Adrian
We stocked up and prepared for a family night in the bathroom. As it happened Townsville got of very lightly and captured much needed rain. I feel there is a sting in the tail with a Cyclone Wati developing! Our thoughts are with those poor people in Innisfail.Adrian, Townsville Nth Qld, Australia
John
We're just a little bit north of the swirly bit, we had been cut off for three days lest week because of torrential rains and floods, now it's the other way around, we have many friends down that way that we haven't heard from as yet but we are assured that there have been no fatalities. The fact that all out services have to come through that region is a little alarming though, thankfully we still have power, unlike last week! But, cyclone Wati is following close behind so the next 72 hours could be interesting. Hey, as they say up here... "hey, you wanted to live in the tropics!"John, Cooktown, Australia
Tom Perry
Myself and a couple of friends are backpacking currently up the East coast of Australia, we are currently stuck on Magnetic island which is a few hundred kilometres south of Innisfail but all ferries were stopped yesterday meaning we have to stay here for a few more nights. Even though we are still quite far away the wind and rain was pretty dramatic last night. We spent yesterday evening packing all loose equipment from the hostel away and then sheltering in our dorms. It was quite dramatic.Tom Perry, Ashford, Kent
Kirsty McCullough
We have been spared the worst. Until about 10pm last night we were expecting to be within the worst of the zones but a last minute shift moved the cyclone far enough north to only give us rain and gales. But our blessing has been the curse of others with awful pictures and stories coming through on ABC local radio of the sheer devastation. Yesterday was very surreal - the real calm before the storm, the intense preparation and then the watching and waiting foe something so unknown yet so inevitable. Very weird 24 hours. Now watching Cyclone Wati which seems to be following in the wake of Larry.Kirsty McCullough, Townsville, Australia
John Stevenson
I live in Trinity beach, 30k north of cairns. It's 2pm and people are starting to get outside to clean up their gardens. In the northern suburbs we got off lightly with only a few road signs and trees down. I drove into cairns to see my daughter and the roads through the botanic gardens are like an obstacle course, with big trees and broken power lines everywhere. I saw little structural damage other than car ports and fences but everybody's garden is deep in broken branches and leaves. We have been told it could be several days before full electricity supply is restored but all in all we seem, at least where I have been, to have got off lightly.John Stevenson, Cairns Australia
Robert White and James King
Our flight was forced to turn back today after reports of a massive cyclone in the Cairns area. We are both now stranded in Brisbane awaiting more news of the opportunity to travel up there. As soon as we get there we should be able to email some pictures of "The most devastating cyclone in decades"Robert White and James King, Banbury, England
Dan
My sister is staying in Cairns while travelling, she just rang to say that it is raining heavily and the roads are covered in water and it is extremely windy and there is debris flying around everywhere. You can hear the roof rattling on the phone and she says that rain is being driven in through the windows.Dan Murphy, UK
How the Saffir-Simpson Scale for rating Cyclone Strength was devised
The Saffir-Simpson scale was devised about 35 years ago by engineer Herbert Saffir and meteorologist Robert Simpson. At the time, Simpson directed the National Hurricane Center in Miami and Saffir ran his own engineering firm in neighboring Coral Gables.
Simpson and Saffir both chuckled when asked about the recent fame of their rating scale. But they also were gratified that their brainchild had found its way into popular speech.
"People are looking for yardsticks," Simpson said. "Our language has demonstrated the use of many expressions that started out to be used for one phenomenon, then were used to refer to many other things."
Saffir said he's "very pleased that the public is aware of the scale and can see the difference between a Category One and a Category Five storm. That's extremely important."
Planning Tool
Saffir and Simpson created the scale to help local relief agencies and emergency management officials better prepare for approaching hurricanes. Until recently, the scale was mostly known to meteorologists and officials at emergency management and relief agencies.
Simpson and Saffir each witnessed powerful hurricanes long before they devised the scale. Simpson watched a hurricane deliver a devastating blow to his hometown of Corpus Christi, Texas, in 1919. Although he was only six years old at the time, he still has vivid memories of that catastrophe.
In the summer of 1947, Saffir, a New York City native, took a job as a county engineer in Miami. Soon after he arrived, a pair of hurricanes put much of South Florida under water.
About 12 years later, Saffir had set up his own engineering firm when the United Nations commissioned him to write a report on providing low-cost housing in areas of the world that are subject to hurricanes.
As he worked on the report, Saffir realized that there were only two ways of categorizing hurricanes—major and minor.
"I worked up five scales [of hurricanes] based on a subjective description of the damage that could occur for each category," Saffir said.
Cyclone Categories
Saffir-Simpson Scale: Cyclone Intensity
-
Category One
Wind speeds: 74 to 95 miles an hour (119 to 153 kilometers an hour)
Barometric pressure: No lower than 28.94 inches, or 980 millibars
Storm surge: 4 to 5 feet (1.2 to 1.5 meters)
Likely damage: Minimal. No significant damage to buildings. Damage will be mainly to unanchored mobile homes, trees, and shrubbery. There also will be some coastal flooding and minor damage to piers.
-
Category Two
Wind speeds: 96 to 110 miles an hour (154 to 177 kilometers an hour)
Barometric pressure: 28.50 to 28.92 inches, or 965 to 979 millibars
Storm surge: 6 to 8 feet (1.8 to 2.4 meters)
Likely damage: Moderate. Damages to some roofs, doors and windows. Considerable damage to trees, shrubbery and mobile homes. Some flooding damages to piers and small craft. Some small craft may break their moorings.
-
Category Three
Wind speeds: 111 to 130 miles an hour (179 to 209 kilometers an hour)
Barometric pressure: 27.91 to 28.47 inches, or 945 to 964 millibars
Storm surge: 9 to 12 feet (2.7 to 3.7 meters)
Likely damage: Extensive. Some damage to small residences and utility buildings. Mobile homes destroyed. Coastal flooding destroys smaller structures, and larger structures damaged by floating debris. Flooding may occur far inland.
-
Category Four
Wind speeds: 131 to 155 miles an hour (211 to 249 kilometers an hour)
Barometric pressure: 27.17 to 27.88 inches, or 920 to 944 millibars
Storm surge: 13 to 18 feet (4 to 5.5 meters)
Likely damage: Extreme. Heavy damage to many residences, with roofs completely destroyed on small residences. Major erosion of beaches. Flooding may occur far inland.
-
Category Five
Wind speeds: Exceeding 155 miles an hour (249 kilometers an hour)
Barometric pressure: Lower than 27.17 inches, or 920 millibars
Storm surge: More than 18 feet (5.5 meters)
Likely damage: Catastrophic. Roofs completely destroyed on many residences and larger buildings. Some buildings completely destroyed. Major flood damage to lower floors of buildings near the shore. Massive evacuation may be required. Flooding may occur far inland.
Cyclone Category in Australia
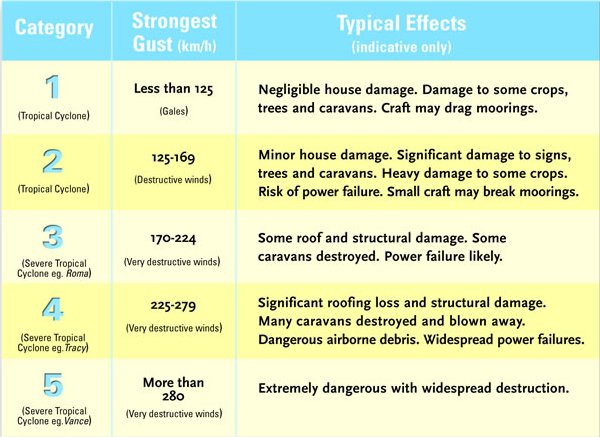
© Copyright Commonwealth of Australia 2006, Bureau of Meteorology (ABN 92 637 533 532) used with permission
International Definitions(Severe Tropical Cyclones, Typhoons and Hurricanes)
Tropical cyclones can be defined in different ways in elsewhere in the world. Often news reports from the United States or Asia will refer to hurricanes or typhoons. These are all tropical cyclones, but with different names. While the category definitions are not identical, the following provides an approximate guide for comparison
| Australian Name |
Australian Category |
US | US Saffir-Simpson Category Scale | NW Pacific | Arabian Sea /Bay of Bengal | SW Indian Ocean | South Pacific (East of 160E) |
|---|---|---|---|---|---|---|---|
| Tropical Low |
- | Tropical Depression | - | Tropical Depression | Depression or Severe Depression |
Tropical Depression | Tropical depression |
| Tropical Cyclone | 1 | Tropical Storm | - | Tropical Storm | Cyclonic Storm | Moderate Tropical Storm |
Tropical Cyclone (Gale) |
| Tropical Cyclone | 2 | Tropical Storm | - | Severe Tropical Storm |
Severe Cyclonic Storm |
Severe Tropical Storm |
Tropical Cyclone (Storm) |
| Severe Tropical Cyclone | 3 | Hurricane | 1 | Typhoon | Very Severe Cyclonic Storm |
Tropical Cyclone | Tropical Cyclone (Hurricane) |
| Severe Tropical Cyclone | 4 | Hurricane | 2-3 | Typhoon | Very Severe Cyclonic Storm |
Intense Tropical Cyclone |
Tropical Cyclone (Hurricane) |
| Severe Tropical Cyclone | 5 | Hurricane | 4-5 | Typhoon | Super Cyclonic Storm |
Very Intense Tropical Cyclone |
Tropical Cyclone (Hurricane) |
Comparison to the damage inflicted by an nuclear bomb
Tropical Cyclone Larry hit Innisfail, Australia, on Monday morning, ripping the roofs off buildings and damaging 55 percent of the homes in the city. "It looks like an atomic bomb hit the place," said the mayor, and city residents repeated his claim. Could Larry's 180 mile-per-hour wind gusts cause as much damage as an atomic bomb?
It depends how you calculate damage. A Category 4 cyclone like Larry might level buildings over an area of 2,500 square miles. (A hurricane is just what we call a tropical cyclone that originates in our part of the world.) It would take a 10-megaton nuclear weapon to inflict damage over such a wide area. By comparison, the atomic bombs dropped on Hiroshima and Nagasaki were only about 15 and 21 kilotons. (There are 1,000 kilotons in a megaton.) It's a little tricky to compare the two, since a nuke would obliterate everything near to the site of the explosion and inflict less damage as you moved farther away. A hurricane, on the other hand, would cause less severe damage, but the damage would be more uniform and over a larger area.
You can get a better sense of how the two compare by looking at the devastation caused by a nuclear weapon at various distances from the explosion. Then, it's possible to figure out what kind of tropical storm would cause a similar amount of damage at each distance. Savannah, Ga., commissioned this kind of analysis in advance of the G-8 meetings of 2004. Part of the study looked at the structural damage caused by a 25-kiloton nuclear explosion. At a radius of three miles, the damage would be equivalent to that caused by a piddling hurricane with wind speeds averaging 80 mph. At half that distance from the blast, the effects would be more like a Category 5 storm with 160 mph winds.
Nuclear explosions can destroy a city with thermal radiation and a wave of kinetic energy. They also generate high-speed winds that cause damage in much the way a hurricane might. The blast wave consists of an expanding line of very high pressure (called "overpressure") that draws gusting winds in its wake. The wave of overpressure sweeps past structures very quickly, followed by winds that can crash into them at hundreds of miles per hour. Thermal radiation can also produce high winds by igniting flammable materials and setting off a mass fire. The rising heat from a mass fire causes cool air to rush in from the periphery at hurricane velocities. A real hurricane works in a similar way.
Nuclear blast-winds don't affect buildings in quite the same way as hurricane winds of the same speed. The nuclear blast-wind looks like a strong pulse, or gust, rather than the sustained winds of a hurricane. In that sense, it causes damage more like a tornado would—by hitting a building with high intensity for a short period. On the other hand, blast winds generally hit a building from one direction like hurricane winds. Tornado winds cause extra damage by twirling around as they hit.
Flooding
Affect of Cyclone Larry on Avocado Growers
Avocados Australia, peak industry body said cyclone Larry had caused devastation to one of the Australia’s largest avocado production areas and to the lives of hundreds of avocado growers.
The main growing areas in North Queensland have been destroyed in the middle of their harvest period. Resulting is large losses for growers in what was looking to be one their most successful seasons in many years.
Over $15 million worth of crop was lost in just a few short hours. The North Queensland avocado crop was currently supplying 80% of the fruit in the market. The next production area to begin harvesting is Bundaberg.
Avocados Australia, Chief Executive Officer Antony Allen said initial reports indicated the majority of production areas had been devastated.
“Communities in producing areas will be severely effected in what was the height of the harvesting and packing period for avocado businesses”, he said.
“We understand some growers have lost their entire avocado crop and large numbers of trees have been completely up-rooted. It could be up to five years before the North Queensland industry is capable of recovery.”
“The North Queensland industry and community will require long term assistance to be able to rebuild and we will work with the Queensland Department of Primary Industries & Fisheries and our fellow peak industry bodies on what can be done to help rebuild the North Queensland horticulture industry.”
Banana growers website was unavailable
How does Cyclone Larry compare to other cyclones?
By Tim ArvierNational Nine News
The images coming out of Innisfail have shocked Australians. Houses have been destroyed, crops obliterated and livelihoods shattered. Many have called Cyclone Larry one of the biggest ever to hit Australia. But how does it actually compare with other cyclones which have struck our shores?
Below is a list of some of the most ferocious cyclones that have lashed Australian towns and cities. We also compare these with Hurricane Katrina.
Cyclone Larry, March 2006.
After wreaking havoc in Innisfail, Larry has now weakened into a low pressure system and is not expected to be any further threat.
At its peak, the cyclone registered winds of up to 290km/h and was graded a category five, the highest possible grading for a cyclone.
While the economic damage may run into the hundreds of millions of dollars, amazingly, no one was killed.
Cyclone Mahina, March 1899.
The most deadly cyclone in Australian history, Mahina struck at Bathurst Bay near Cape Melville in Queensland.
It completely destroyed a pearling fleet, with over 400 people losing their lives.
Massive flooding affected many Aboriginal communities, with around 100 indigenous Australians thought to have perished.
Unfortunately no comprehensive documentation of Mahina's size or wind speeds exists.
Cyclone Ada, January 1970.
A category four cyclone, Ada struck holiday resorts on the Whitsunday Islands in north Queensland.
Fourteen people were killed and luxury yachts worth millions of dollars destroyed.
Widespread flooding also occurred between Bowen and Mackay.
Cyclone Tracy, December 1974.
Probably the most famous cyclone in Australian history, Tracy flattened Darwin on Christmas Eve 32 years ago.
Of a population of 43,000, 25,000 had their homes destroyed as Tracy scored a direct hit.
Sixty-five people were killed, 16 of them at sea.
Tracy's wind gusts recorded speeds of up to 250kmh and she was graded a category four.
She also dumped 195mm of rain on Darwin in under eight hours.
Cyclone Winifred, February 1986.
This cyclone also ravaged Innisfail. While it crossed the coast further south than Larry and was only a category three, it still managed to destroy 50 homes and damage hundreds of other large buildings around the town.
Three people died and millions of dollars worth of sugar cane and fruit crops were ruined.
Cyclone Bobby, February 1995.
Cyclone Bobby was graded a category four and passed the coast near the town of Onslow in Western Australia.
While it damaged many farms and houses, the biggest losses occurred at sea, where seven people were killed after their boats sank.
Cyclone Ingrid, March 2005.
Ingrid is infamous for threatening not only northern Queensland but also the Northern Territory.
It passed the Queensland coast north of the Lockart River, moved across the mainland into the Gulf of Carpentaria and then terrified residents in the Top End.
While Ingrid was an intense category five cyclone with wind speeds of almost 300kmh, it wasn't very large, which meant its severe impact was limited to what lay directly in its path.
Ultimately the cyclone passed wide of Darwin and although many rural properties were damaged, no fatalities were recorded.
Hurricane Katrina, August 2005.
While they have different names, hurricanes and cyclones are actually the same thing, also known as typhoons in southeast Asia.
With winds of up to 280kmh, Hurricane Katrina is comparable in strength to many of Australia's cyclones.
However, in terms of size and the damage it caused, Katrina makes our disasters look like a storm in a teacup.
Striking Louisiana, Mississippi and Alabama, Katrina was the biggest hurricane to hit the US since record-keeping began.
It led to the deaths of 1599 people and is estimated to have caused over 100 billion dollars in damage.
At its peak it measured around 640km in diameter. In comparison, Cyclone Tracy was only 50km wide.
However, despite such massive wind speeds and immense size, much of the damage was actually caused by storm surge.
A common feature of cyclones, storm surge is a sudden, dramatic rise in ocean levels caused by the increased winds.
In Katrina's case, the breaking of levees combined with a dramatic surge saw 80 percent of New Orleans flooded.
When the hurricane finally passed, lawlessness, disease and a slow relief effort quickly became the main problems.
So while it will be of little comfort to those sleeping out in the aftermath of Larry, they can at least console themselves that relief is on the way, no looting has been reported and health authorities insist the risk of disease is extremely low.

